Financial Performance

Record-breaking revenues conclude a decade of remarkable growth
Widgets
Content

The school was able to celebrate the end of an extraordinary and eventful decade with the announcement of record-breaking annual revenue. For the first time ever, INSEAD broke the €300 million barrier, which represents 100% revenue growth in just ten years. This is all the more impressive given the turmoil in the world economy as a result of Covid-19 and geopolitical upheaval for much of that period. Indeed, the final revenue results exceeded the expectations that we had earlier in the year, thanks largely to the outstanding performance of Executive Education and the dedication of our staff and faculty across the school.


At the same time, the market for Degree Programmes was challenging but is showing signs of a slightly more positive outlook for 2023–2024. Other financial challenges included continued inflationary pressure and the need for significant long-term investment, particularly in the infrastructure of the Europe Campus. Additional participant levels in Executive Education also meant increased expenditure, but we are implementing more focused financial oversight, cost management and supplier negotiations, supported by the efforts of our dedicated Procurement Team.


Looking ahead, we are cautiously optimistic. However, we are taking nothing for granted, especially given our commitment to investing in the Europe Campus Reimagination over the coming years. The project is ambitious, but we will be fundraising for it very actively, and our teams have a strong commitment to ensuring that it runs smoothly to meet the objective of creating a vibrant and sustainable intellectual environment. In summary, INSEAD is beginning an exciting new chapter – and it does so from a strong financial base.

Total Revenue in 2022/2023

Financial Indicators

Content

INSEAD is a not-for-profit institution with entities in various countries. Therefore, we are not required to publish consolidated accounts; however, all our statutory accounts are audited. We maintain a governance structure that includes several committees of the Board responsible for Audit, Finance and Risk; Endowment Management; and Remuneration. These financial indicators are directly extracted from audited combined accounts based on International Financial Reporting Standards (IFRS).

Column 1
In €’000
Column 2
2023
Column 3
2022
Column 4
2021
Column 1
Total Income
Column 2
309,286
Column 3
284,474
Column 4
217,727
Column 1
Operating Cash Flow
Column 2
2,365
Column 3
5,221
Column 4
(9,896)
Column 1
Cash Flow from Endowment (transfer to operations)
Column 2
15,100
Column 3
16,190
Column 4
21,029
Column 1
Net Cash Flow from / (Used in) Financing
Column 2
(24,954)
Column 3
914
Column 4
(11,480)
Column 1
Net Cash Flow Used in Investing
Column 2
(14,328)
Column 3
(15,753)
Column 4
(4,075)
Column 1
Interest Paid
Column 2
(1,600)
Column 3
(796)
Column 4
(630)
Column 1
Changes in Working Capital & Exchange Losses/Gains
Column 2
(3,632)
Column 3
5,317
Column 4
21,290
Column 1
Cash Flow
Column 2
(27,048)
Column 3
11,093
Column 4
16,238
Column 1
Cash at year end
Column 2
123,281
Column 3
150,330
Column 4
139,237
Column 1
Endowment at beginning of the year
Column 2
369,979
Column 3
351,364
Column 4
281,559
Column 1
Donations received, Net
Column 2
17,201
Column 3
24,496
Column 4
16,662
Column 1
Gains (and Losses) from Investment Activities
Column 2
(2,845)
Column 3
10,309
Column 4
74,172
Column 1
Transfer to operations
Column 2
(15,100)
Column 3
(16,190)
Column 4
(21,029)
Column 1
Endowment at year end
Column 2
369,235
Column 3
369,979
Column 4
351,364
Column 1
Endowment performance rate
Column 2
−0.6%
Column 3
2.9%
Column 4
26.1%

Endowment

Steady course through a dynamic market environment
Widgets
Content

The past year presented us with a challenging market landscape, albeit with a gradual shift towards a more positive outlook. Global GDP growth exceeded expectations, with a projected increase of 2.7% for 2023, bolstered by robust consumer spending and exceptionally supportive fiscal policies in the United States. Simultaneously, there was a decline in headline inflation. Central banks responded by moderating the pace of interest rate hikes, while also signalling a potentially prolonged period of elevated rates.


In this context, equities rebounded impressively, registering a growth of +10.1% in the last Academic Year, marking a significant recovery from the -12.2% downturn in the preceding year. However, government bonds continued their downward trajectory, dropping by -2.2% following a challenging 2021–2022, which saw a -15.3% decline. The US Dollar experienced a -8.3% devaluation against the Euro.¹


1. MSCI All Country World Index, with Developed Markets 100% Hedged to Euro, and FTSE EuroBIG TR Euro.

Performance analysis

Content

Over the Academic Year, the investment portfolio saw a slight decrease of -0.8% in Euro terms, but an increase of +3.2% in local currency, net of fees and expenses. This performance contrasts with the composite benchmark’s +5.2% rise in local currency, gross of fees. The public market portfolio within the Endowment thrived, showing a +6.4% growth, primarily driven by global equities, absolute return and credit allocations. However, the private markets portfolio remained relatively stagnant, offsetting some of its previous gains. The depreciation of the US Dollar also impacted our Euro-denominated returns. Notably, our portfolio outperformed the majority of the US Ivy League endowments in local currency terms over this period, particularly in light of their larger private market and venture capital allocations, which decreased in value during the year.


Over the past decade, the investment portfolio has grown by +7.7% per annum in Euro terms (net of fees, +7.8% in local currency), surpassing the +6.5% annual growth of the composite benchmark in local currency, gross of fees. The portfolio has cumulatively outperformed its benchmark by 22.5% over this period, with the private market allocations being the most significant contributor, yielding an annual return of +15.3%.

Focusing on the future

Content

Looking ahead, we remain optimistic about replicating the strong returns of the past decade, while acknowledging the recent paradigm shifts in the economic landscape. The Endowment Management Committee has strategically repositioned the portfolio to leverage macroeconomic volatility, with a focus on augmenting income-producing assets, especially in private credit, and diversifying into less correlated exposures.


The Sustainable Investments sub-committee, under Professor Lucie Tepla’s leadership, continues to refine our commitment to sustainable investing, ensuring the continued integration of environmental, social and governance factors into our investment process.

Title

Acknowledgements

Content

I extend heartfelt thanks to our donors for their generous support and trust. I also express my gratitude to the members of the Endowment Management Committee for their invaluable guidance and insights, as well as to the INSEAD executive team for their exceptional stewardship of our institution.


On behalf of the Endowment Management Committee, I would like to express our deepest appreciation to Ilian Mihov for his outstanding leadership and commitment to schoolwide excellence, and we warmly welcome Francisco Veloso as the new Dean. We are excited to collaborate with Francisco and his team on strengthening the Endowment, further empowering INSEAD to unite diverse perspectives and cultivate responsible leaders who will positively transform business and society.


Alexis Habib MBA’81

Endowment Management Committee Chair

Alexis Habib
Alexis Habib MBA’81, Endowment Management Committee Chair

Our investment strategy

Content


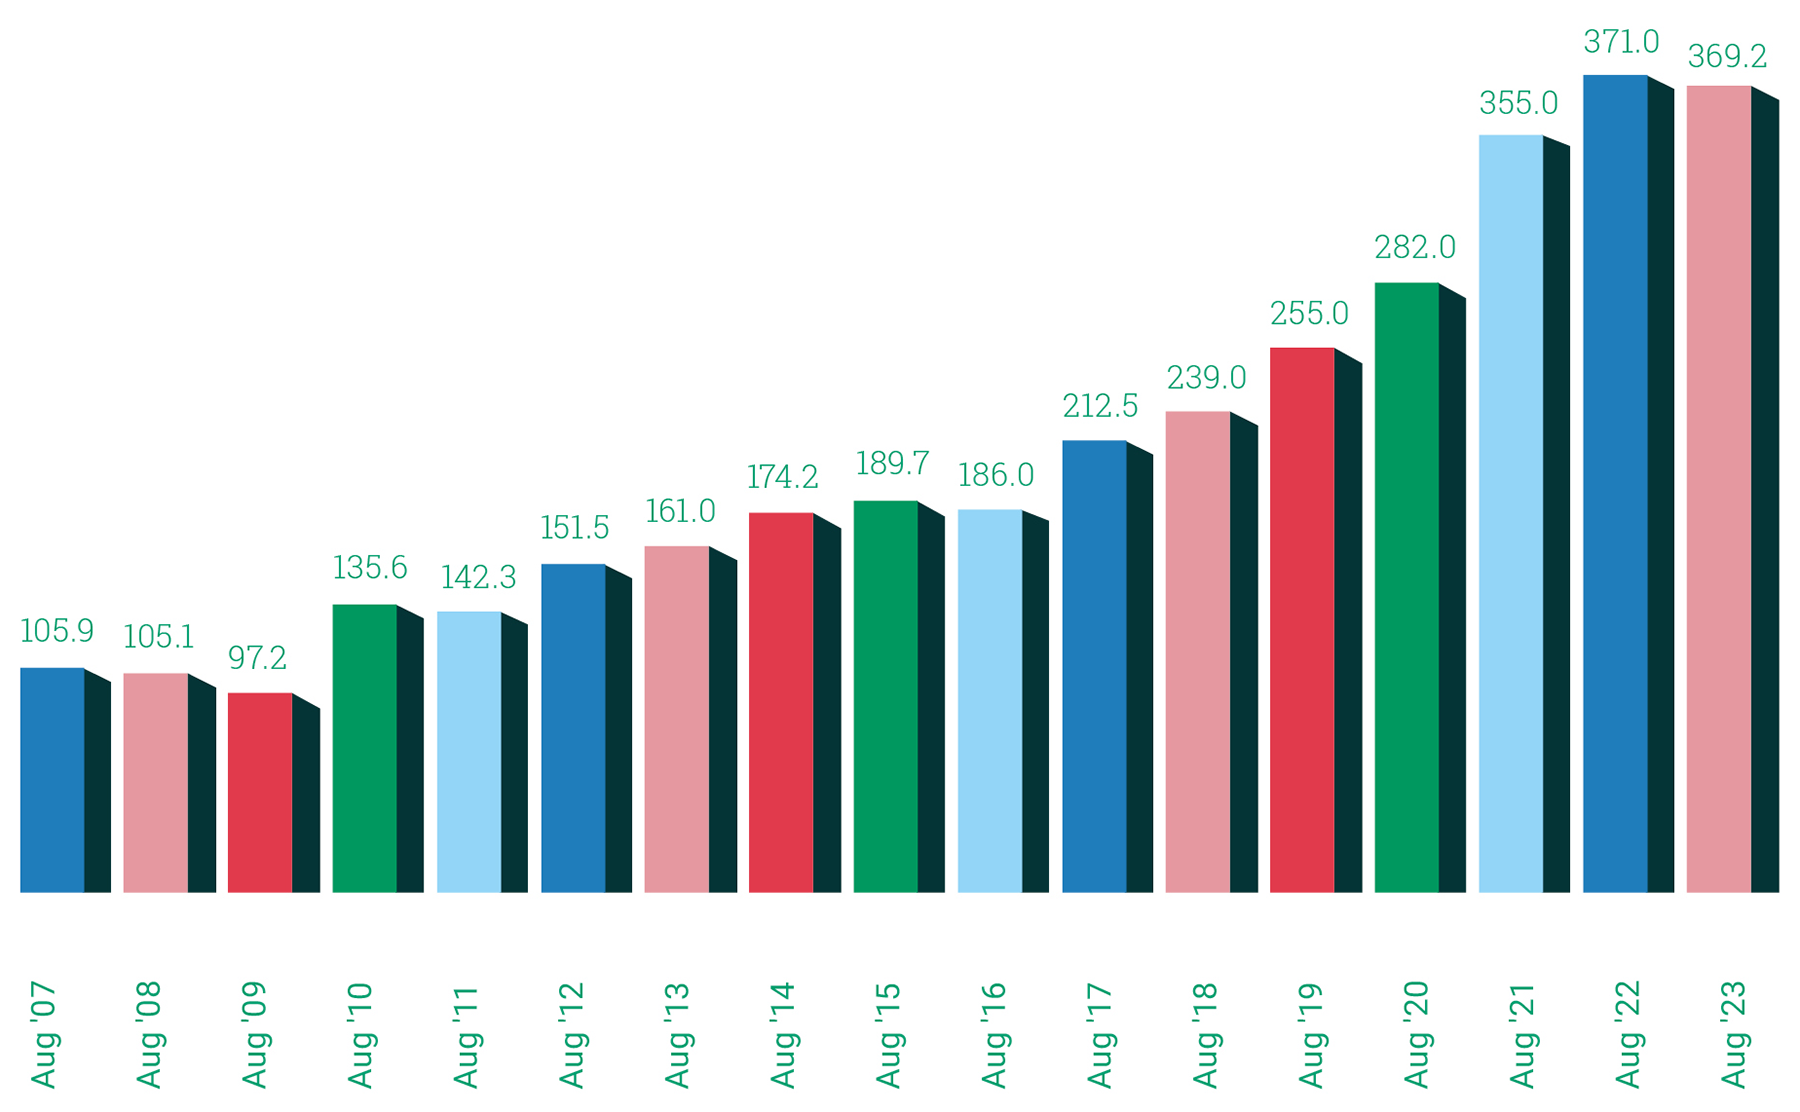
Focus on long-term growth


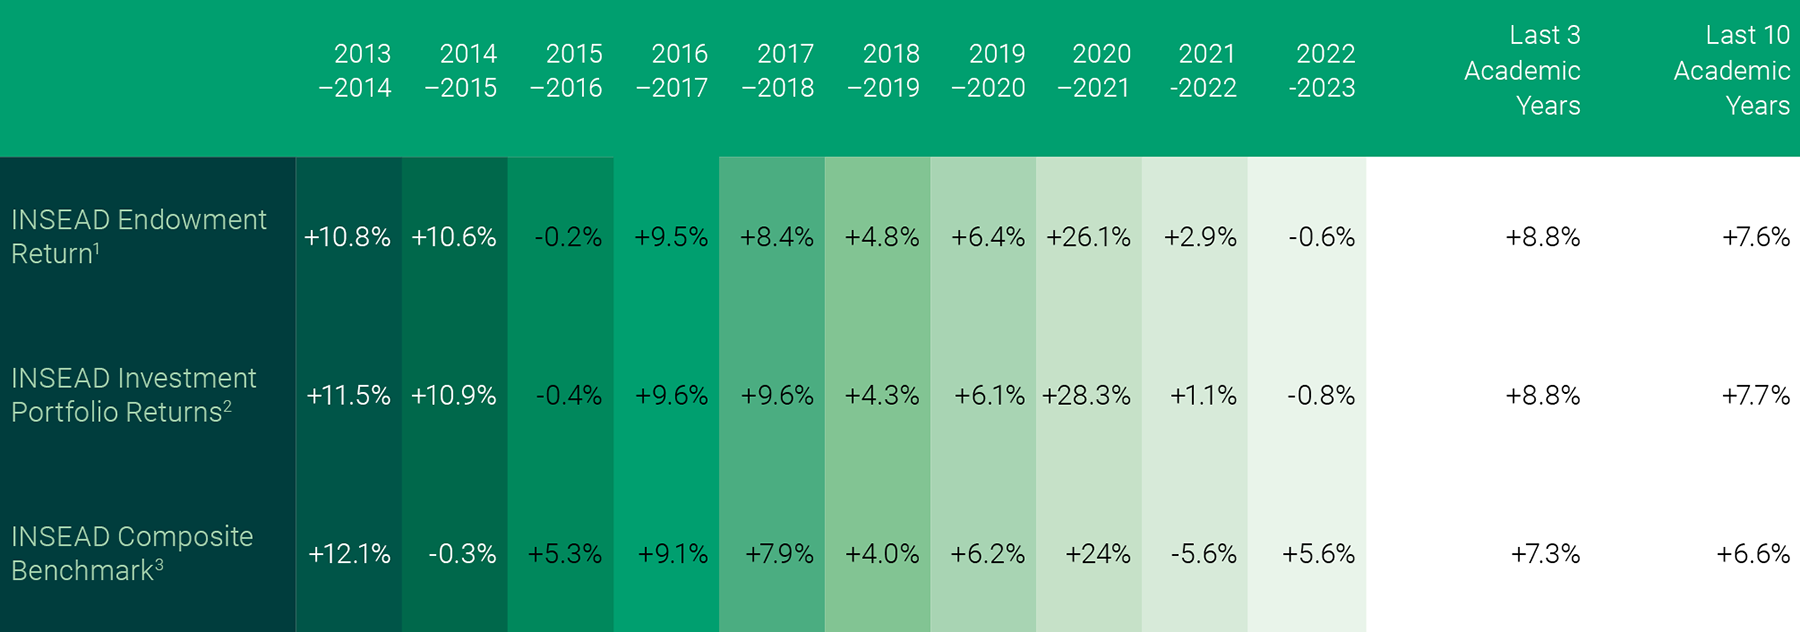
The Endowment’s investment strategy is firmly anchored in maximising long-term risk-adjusted returns, with a strong emphasis on integrating ESG factors into our decision making. We are guided by the following principles:


  • High equity exposure, aligned with our long-term outlook;
  • Diversified asset classes, including a significant allocation to private markets where we see the greatest potential for outperformance;
  • Selective asset-manager engagement, focused on the most skilled in each asset class;
  • Sustainable investment practices, reflecting INSEAD’s commitment to business as a force for good.


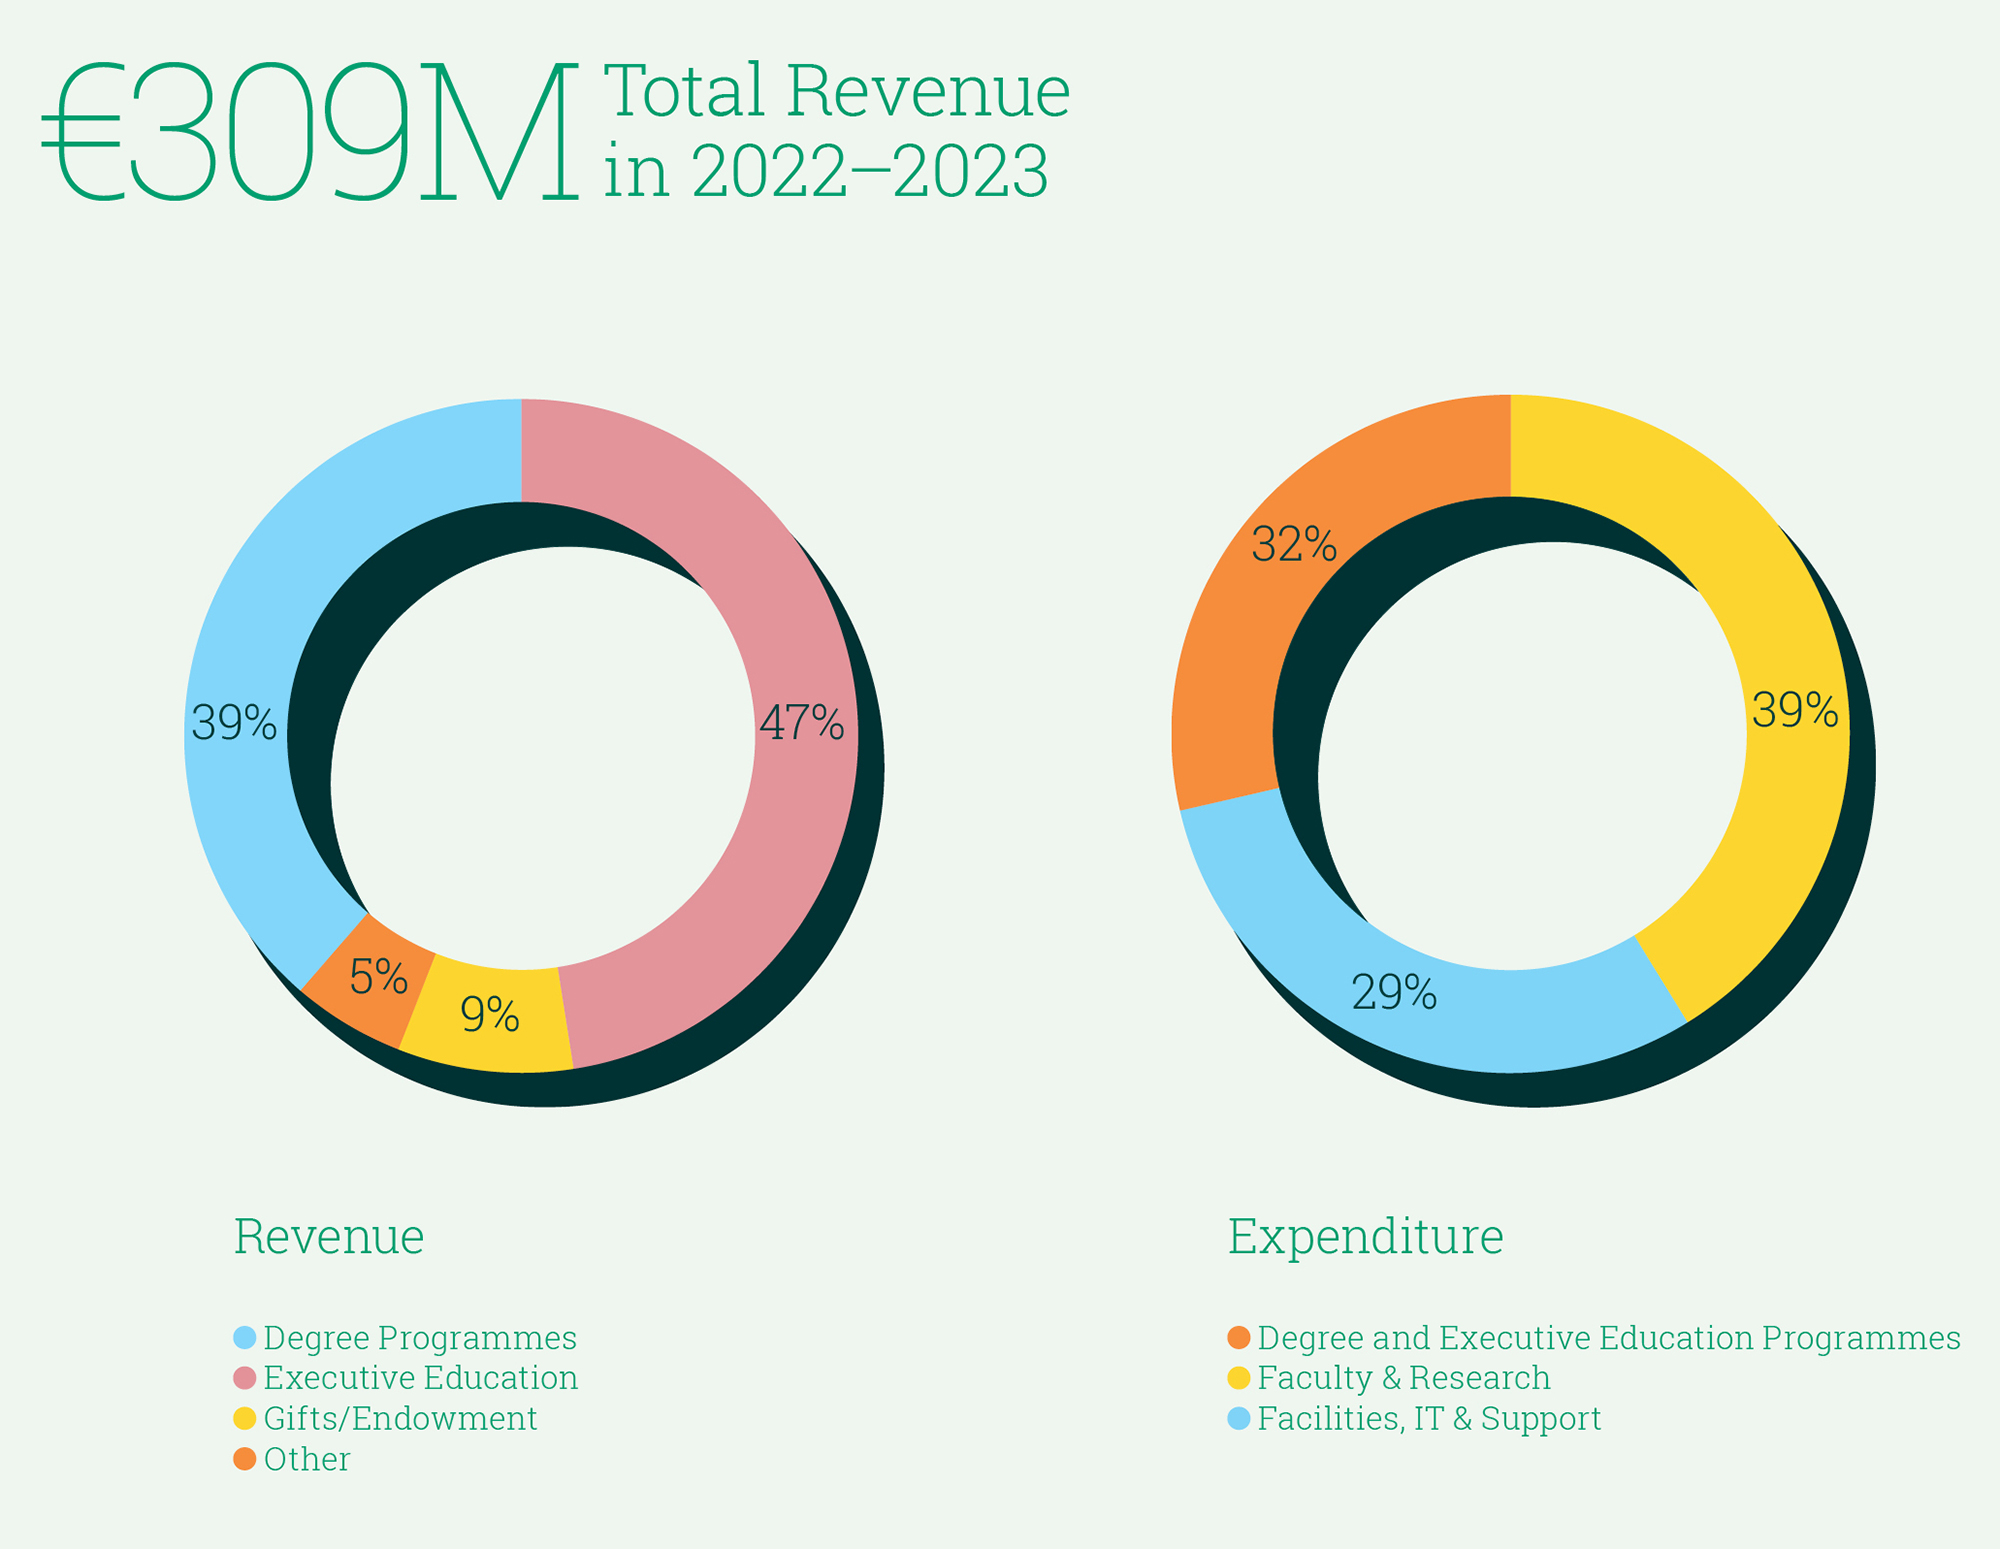
Portfolio allocation


Private markets (40%): This includes private equity, real estate and private debt, targeting the illiquidity premium typically ranging between +3% and +5%. Our private-market investments are diverse, encompassing venture capital in early-stage tech firms, private equity in lower middle-market companies, European real estate and senior loans to private businesses. We have continued to ramp up our commitments to private debt and to buyout managers with a proven ability to bring value-enhancing operational improvements to their portfolio companies.


Public equities (38%): This, combined with our private-market portfolio, forms the core of our long-term, return-generating strategy. Our public equity investments include a mix of actively managed long-only and long-short funds, alongside passive index trackers.


Credit investments (15%): To capitalise on higher yields, we have increased our allocation to credit investments across both public and private strategies.


Hedge funds and inflation-linked bonds (7%): Our investment in absolute-return hedge funds is designed to yield returns with minimal correlation to traditional assets and thrive in higher volatility. Inflation-linked government bonds offer additional protection against unexpected inflation spikes.


Investing in partnership


While the Endowment Management Committee holds direct responsibility for our investments, our portfolio is skilfully managed by Partners Capital, our advisors since 2007. We extend our gratitude to Partners Capital for their support in fostering the long-term growth of our Endowment over the last remarkable decade in INSEAD’s history.

Title

INSEAD Investment Portfolio Performance Over A Decade

INSEAD Investment Portfolio Performance Over A Decade
Notes
1. The Endowment Portfolio is composed of the Investment Portfolio managed by Partners Capital, and other assets directly held. The Investment Portfolio represents the majority of the assets of the Endowment (above 95%). Differences between the performances of the Investment and Endowment Portfolios are due to timing discrepancies and the performance of the assets directly held. Over the long term, the performance of the Investment Portfolio and the Endowment Portfolio are expected to be similar.
2. The INSEAD Investment Portfolio consists of the portfolio managed by Partners Capital.
3. The INSEAD Composite Benchmark is a custom benchmark comprised of asset class indices (e.g. MSCI World NR 100% Hedged to Euro for the equity allocation and State Street Private Equity Index for the private equity allocation) and weighted to reflect the long-term strategic asset allocation adopted by the committee.
Title

Total Assets of Endowment Portfolio in €M (August 2007 – August 2023)

Total Assets of Endowment Portfolio in €M (August 2007 – August 2023)
Notes
4. Private Equity Index for the private equity allocation) and weighted to reflect the long-term strategic asset allocation adopted by the committee.

Download

Annual Report Description
We are pleased to provide downloadable versions of Our Year in Review 2022–2023 and annual reports from previous years. All downloads are available in the PDF file format.